Accuracy of Physical Examination and Imaging Findings for the Diagnosis of Elevated Intracranial Pressure
Positive Findings (Patient Has This)
| Finding | Increased Disease Probability (Positive Likelihood Ratio) |
|---|---|
| Pupillary dilation | |
| Compression or absence of the basal cisterns on CT | |
| Midline shift >10 mm on CT |
Negative Findings (Patient Doesn't Have This)
| Finding | Decreased Disease Probability (Negative Likelihood Ratio) |
|---|---|
| Pupillary dilation | |
| Compression or absence of the basal cisterns on CT | |
| Midline shift >10 mm on CT |
Source
Study Population: 40 studies comprising 5,123 patients
Narrative
The systematic review and meta-analysis discussed here included all retrospective, prospective observational, and randomized controlled trials of adult patients (age ≥ 16 years) in the Emergency Department or Intensive Care Unit that assessed physical examination findings, brain computed tomography (CT), ocular nerve sheath diameter on ultrasound, or transcranial Doppler indices.7 The reference standard consisted of either an ICP reading > 20 mm Hg on invasive ICP monitoring or craniectomy with an operative diagnosis of elevated ICP. The primary outcome was the diagnostic accuracy of the aforementioned tests for diagnosing increased ICP.
The systematic review identified 40 studies (n = 5123 patients) which met the inclusion criteria. Twenty-four studies were prospective cohort studies, 15 were retrospective, and 1 was a randomized controlled trial. Twenty studies included patients with TBI, 3 subarachnoid hemorrhage, 2 intracerebral hemorrhage, 2 hepatic failure, 1 ischemic stroke, and 12 mixed populations of primary brain injury. Only 3 physical examination findings (pupillary dilatation, motor posturing, and altered mental status) had adequate relevant studies to allow for a metaanalysis. Table 1 demonstrates the findings associated with elevated ICP.
Table 1. Findings suggestive of elevated intracranial pressure (adapted from Fernando et al.).7
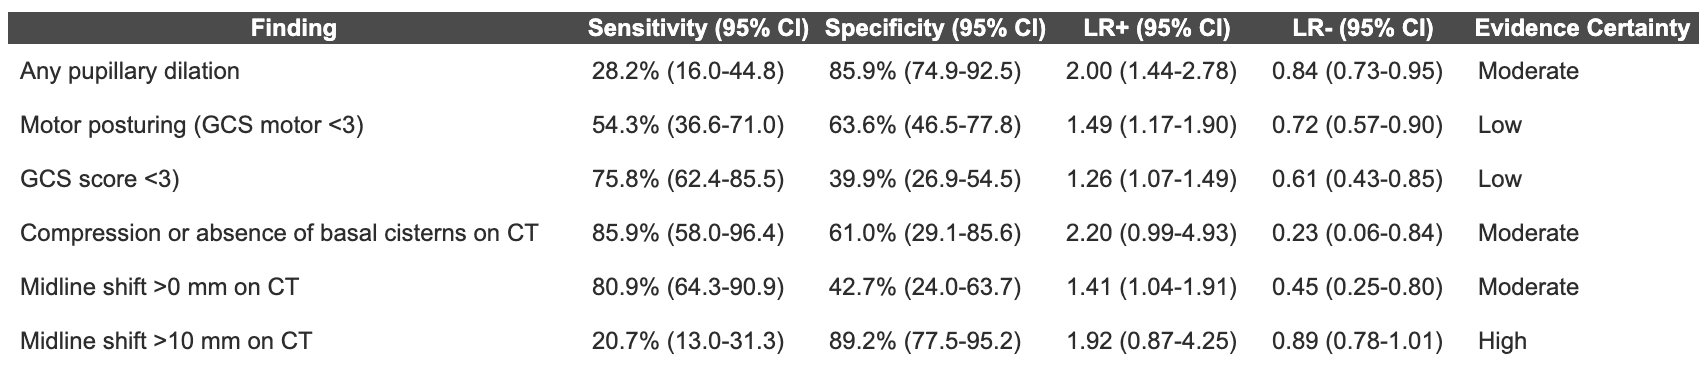
Abbreviations: CI – confidence interval, LR – likelihood ratio, GCS – Glasgow Coma Scale, CT – computed tomography, mm – millimeters.
Measuring ocular nerve sheath diameter with ultrasound appeared to have a high discriminatory power with the pooled area under the receiver operating characteristic (AUROC) curve of 0.94 (95% CI 0.91 to 0.96). The sensitivity and specificity of the test were dependent on the cut-off used for increased optic nerve sheath in each study, precluding the possibility of meta-analysis to calculate pooled sensitivity and specificity. Authors calculated AUROC values for transcranial doppler pulsatility index (TCD-PI) to detect ICP > 20 mm Hg based on 3 studies, finding a pooled AUROC value of 0.85 (95% CI 0.78 to 0.91) with use of combined TCD arterial blood pressure methods.
Caveats
Based on the existing evidence, most findings are insufficiently sensitive or specific for the diagnosis of increased ICP. Therefore, physical examination findings, CT, ocular nerve sheath diameter, and transcranial Doppler do not appear to be reliable in identifying or excluding increased ICP.
The original manuscript was published in Academic Emergency Medicine as part of the partnership between TheNNT.com and AEM.
Published/Updated
What are Likelihood Ratios?
LR, pretest probability and posttest (or posterior) probability are daunting terms that describe simple concepts that we all intuitively understand.
Let's start with pretest probability: that's just a fancy term for my initial impression, before we perform whatever test it is that we're going to use.
For example, a patient with prior stents comes in sweating and clutching his chest in agony, I have a pretty high suspicion that he's having an MI – let's say, 60%. That is my pretest probability.
He immediately gets an ECG (known here as the "test") showing an obvious STEMI.
Now, I know there are some STEMI mimics, so I'm not quite 100%, but based on my experience I'm 99.5% sure that he's having an MI right now. This is my posttest probability - the new impression I have that the patient has the disease after we did our test.
And likelihood ration? That's just the name for the statistical tool that converted the pretest probability to the posttest probability - it's just a mathematical description of the strength of that test.
Using an online calculator, that means the LR+ that got me from 60% to 99.5% is 145, which is about as high an LR you can get (and the actual LR for an emergency physician who thinks an ECG shows an obvious STEMI).
(Thank you to Seth Trueger, MD for this explanation!)